Understanding Training Stress: Making Sense of TSS, Training Load, and Other Metrics
Training is about more than just putting in time on the water or in the gym—it’s about balancing effort and recovery so you can improve without burning out. This balance is often described as training stress. But depending on the device, platform, or coach you follow, you may see different terms and numbers used to track it. Let’s break down what training stress really means and how popular platforms like TrainingPeaks and Garmin quantify it—and how this ties directly into progressive overload.
What is Training Stress?
At its core, training stress is a way of measuring how hard a workout is on your body. Two main factors determine stress:
- Volume – how long you train.
- Intensity – how hard you push during that time.
The higher the intensity and/or the longer the duration, the greater the stress. Too little stress and you won’t improve; too much without recovery and you risk overtraining. Training stress metrics give paddlers and athletes a way to monitor this balance objectively.
This concept directly supports progressive overload: gradually increasing training stress in a planned way over weeks and months, so the body adapts with improved fitness. Without a way to measure stress, it’s nearly impossible to apply progressive overload systematically.

Defining Intensity with Heart Rate
For many paddlers, heart rate (HR) is the most accessible and reliable way to define intensity. Intensity zones are often based on your lactate threshold heart rate (LTHR). LTHR is the highest average heart rate you can sustain steadily for about 40–60 minutes, and it serves as a personal anchor point for training zones.
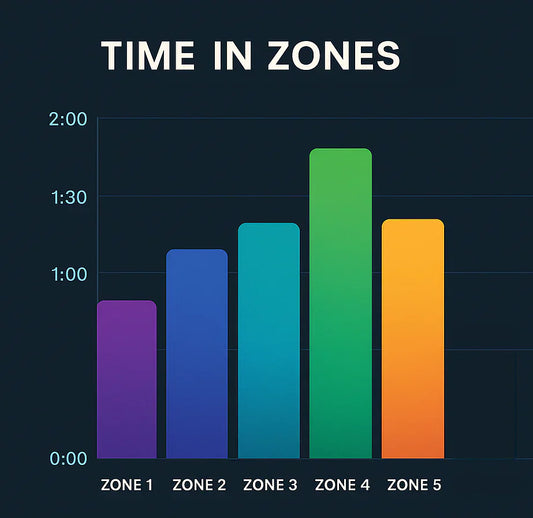
A simple zone model:
- Zone 1 (Recovery): < 78% of LTHR
- Zone 2 (Aerobic Endurance): 79–86% of LTHR
- Zone 3 (Tempo): 87–93% of LTHR
- Zone 4 (Threshold): 94–102% of LTHR
- Zone 5 (VO2 Max): > 102% of LTHR
Example: If your LTHR is 170 bpm, paddling for 60 minutes at ~170 bpm (Zone 4, threshold effort) would equal about 100 TSS. This is because TSS is benchmarked against one hour at threshold = 100 TSS. A 60-minute paddle at 150 bpm (about Zone 2) might only score ~50 TSS, even though the duration is the same.
Using HR zones in this way helps paddlers apply progressive overload: gradually building time in higher zones or extending session length in lower zones to increase overall training stress.
Training Stress Score (TSS) – TrainingPeaks
TSS is one of the most widely recognized measures of training stress. It was developed by Dr. Andrew Coggan and is used heavily in TrainingPeaks.
- How it’s calculated: TSS combines workout duration and intensity, based on your Functional Threshold Power (FTP) in cycling or an equivalent threshold in other sports. For paddlers, a threshold pace, heart rate, or power (if using an outrigger canoe power meter) can be used.
-
Example values:
- 100 TSS ≈ 1 hour at threshold effort.
- 50 TSS ≈ an easy hour at half-threshold.
- 150+ TSS ≈ a very hard session.
The beauty of TSS is that it provides a common “currency” across workouts. A 2-hour easy paddle might accumulate the same TSS as a 45-minute high-intensity session, but the physiological stress and recovery needs are different. This flexibility is critical for structuring progressive overload while still respecting recovery.
Training Load – Garmin
Garmin uses the term Training Load, which is derived from EPOC (Excess Post-Exercise Oxygen Consumption). EPOC is a measure of how much oxygen your body needs to recover from a workout, which reflects the stress placed on your system.
- Scoring system: Garmin’s Training Load is a rolling 7-day total, with recommended zones to keep you “maintaining,” “productive,” or “overreaching.”
- Why it matters: Instead of focusing on threshold-based calculations like TSS, Garmin emphasizes how the workout impacts your body’s recovery and adaptation.
- Practical use for paddlers: It’s especially helpful if you use a Garmin watch with heart rate and GPS, since it automatically adjusts to your fitness changes.
In the context of progressive overload, Garmin’s Training Load ensures you’re applying enough stress to improve but not so much that you cross into chronic fatigue.
Other Popular Metrics
Strain (Whoop)
Whoop quantifies training stress as Strain, which is based on cardiovascular load (heart rate response) during the day. It gives a simple 0–21 score for how much stress you’ve accumulated.
- Strength: Very accessible and easy to understand.
- Limitation: Doesn’t capture sport-specific intensity as precisely as TSS.
CTL/ATL/TSB (Chronic/Acute Load) – TrainingPeaks
Beyond TSS, TrainingPeaks also uses CTL (fitness), ATL (fatigue), and TSB (form) to show how your recent training compares to long-term load. This model helps with planning tapers and peak phases.
This ties directly into progressive overload by showing how your training load is trending over weeks and months, ensuring fitness increases without pushing into overtraining.
HRV-based Load – Oura, HRV4Training, etc.
Some platforms track training stress by measuring changes in Heart Rate Variability (HRV), which reflects nervous system recovery. Instead of scoring the workout itself, these tools show how your body is responding over time.
This helps confirm whether your progressive overload plan is sustainable—or if you need extra recovery.
Why We Recommend TrainingPeaks
While Garmin, Whoop, and other platforms provide valuable insights, we recommend TrainingPeaks for paddlers who want structured, long-term progress. Here’s why:
- Precision: TSS and related metrics (CTL/ATL/TSB) are sport-specific and tied to your personal threshold, making them highly accurate for paddling.
- Progressive overload planning: The Performance Management Chart (PMC) in TrainingPeaks lets you see fitness, fatigue, and form trends over time—ideal for periodized training.
- Flexibility: You can log water sessions, strength workouts, and cross-training all in one place.
- Coach integration: If you’re working with a coach, TrainingPeaks is the gold standard for sharing workouts, feedback, and analysis.
For paddlers serious about sustainable improvement, TrainingPeaks provides the most complete toolkit for monitoring training stress and applying progressive overload effectively.
Comparison of Training Stress Metrics
Here’s a quick side-by-side comparison of the most popular systems:
| Platform/Metric | Basis of Calculation | Output Format | Strengths | Limitations |
|---|---|---|---|---|
| TrainingPeaks TSS | Duration × Intensity (relative to threshold) | Numeric score (e.g., 50, 100, 150) | Sport-specific, useful for structured training | Requires accurate threshold testing |
| Garmin Training Load | EPOC (oxygen cost of recovery) | Rolling 7-day load score | Auto-adjusts with fitness changes | Less sport-specific precision |
| Whoop Strain | Heart rate response (cardiovascular load) | 0–21 scale | Simple, daily readiness tracking | Doesn’t reflect threshold intensity |
| CTL/ATL/TSB | Rolling average of TSS (long vs short-term) | Fitness/Fatigue/Form curves | Great for planning training cycles | Can be complex to interpret |
| HRV-based Load | Nervous system recovery (HRV changes) | Daily readiness score | Direct insight into recovery | Doesn’t measure workout intensity |
Key Takeaway
All of these metrics—TSS, Training Load, Strain, CTL/ATL/TSB—are trying to capture the same thing: how much stress your training places on your body, and how well you’re adapting. No system is perfect, but using one consistently helps paddlers make informed decisions about when to push harder and when to recover.
And that’s where the link to progressive overload becomes clear: by tracking training stress, you can steadily build fitness with planned increases in load, while ensuring recovery keeps pace. Whether you’re analyzing TSS in TrainingPeaks, watching your Training Load in Garmin, or checking daily Strain on Whoop, the goal is the same: apply stress in a progressive, structured way so your performance keeps climbing without burning out.